Editor's note: The following blog post originally appeared on Levi Gundert's Substack page.

Developing stories that instill confidence in governance bodies (GBs) is prominent in many CISO discussions – but not all stories carry the same value. I was recently in Singapore, engaging in a fireside chat with the esteemed John Yong. John, a seasoned expert in security practice, policy, and administration, currently serves in multiple oversight/governance roles. During our conversation, John emphasized that any threat report or narrative that fails to adequately capture volume and velocity is, in his view, a C- at best. As he put it, its a $10 story. The security industry, he believes, needs better resources to consistently develop $1M stories.

Volume & Velocity
Johns grading assessment underscores the importance of volume and velocity in convincing readers of the necessity for action. Simply put, volume represents the magnitude of change, while velocity highlights how quickly the change has occurred. As cybersecurity professionals, our data-driven discussions are powerful influencers toward a desired outcome, often leading to buy-in on new security control investments.
Volume and velocity are the two variables that underpin a compelling threat implication. Great cyber intelligence will provide this context, similar to the business intelligence financial traders require to execute trades while monitoring financial markets. Professional traders who ignore volume and velocity do so at their peril. The same applies to cyber security and intelligence leaders, whether they know it or not.
Lets review a few examples where volume and velocity create different enterprise recommendations.
Arm Exploit Volume
In a recent Bloomberg interview, Microsoft CEO Satya Nadella revealed that Microsoft is all in on manufacturing hardware (personal computers) optimized for GenAI to enable local/edge-accessible capabilities. Others, like Dell, echo their intent to move quickly to the same destination. While this is good news for Wall Street favorites like Nvidia, CIOs should look for the second-order business, technology, and security implications of the proliferation of GenAI-enabled hardware.
One apparent second-order effect is the increased adoption of Arm semiconductors, which is potentially less considered in this local AI hardware movement. What are the potential security considerations as workstations move from using Intels traditional x86 architected semiconductors to Arm? Are CISOs developing recommendations? How do volume and velocity factor in? Lets find out.

When performing Recorded Future platform searches, specific memory registers and exploit framework library syntax enable differentiated selectors between Arm and x86 semiconductor architectures. The search results represent a sample of instructions or conversations (in multiple languages) related to the technical complexities of hacking ARM-based software (or hardware). In this case, we can remove references to CTF (Capture the Flag) events, commercial frameworks, or shared code (i.e., Metasploit or BishopFox) that perform the heavy lifting of exploit development. The remaining results capture less well-known exploit code.
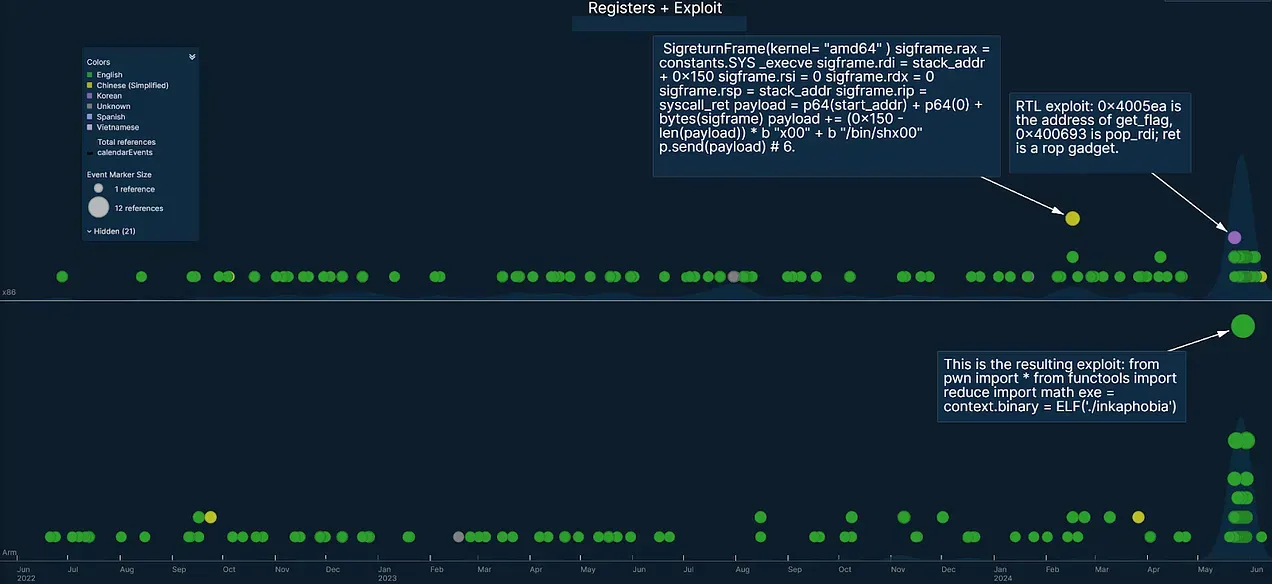
Image: Comparisons of Arm and x86 exploit code references, respectively, courtesy of Recorded Future.
The prior two years reveal consistent Arm-based and x86-based exploit code appearances, with recent spikes in May 2024. The sample size is relatively small, but visually, the increased volume of exploit references is apparent. Now, more discovery/analysis is needed to understand context and velocity.

Image: Recorded Future LLM summarization of Arm exploit results.
The results primarily derive from GitHub and Hackyx, as well as a smattering of different foreign language forums and chat channels.
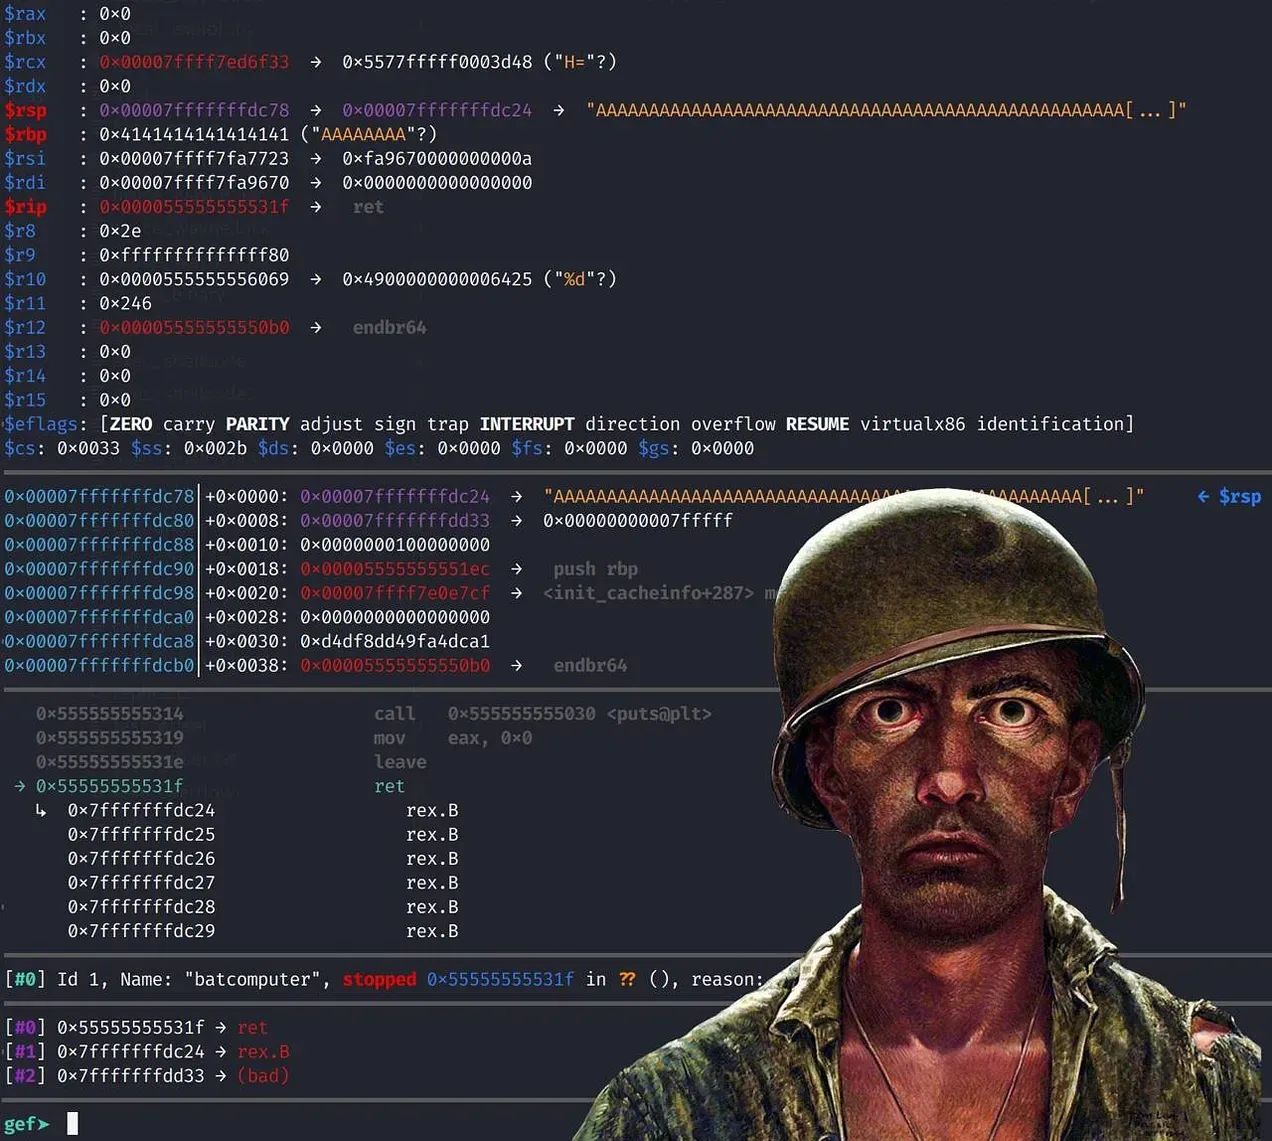
Image: A 1000 yard stare meme overlaid on a buffer overflow example, possibly derived from code found at deephacking.tech.
As referenced in the Intelligence to Risk (I2R) framework, broad consumption of different event types creates more confidence in volume and velocity, which influences a threat implication and potential future associated risk recommendation. Open and closed-sourced code references provide an initial volume signal in this example. Additional data sourcing might also include honeynets and malware sample analysis.
A ninety-day search through Triage for files that match Linux and Arm tags returns roughly 6000 results. Thats a relatively small number in the pantheon of daily malware processed, but file verdicts provide a different event source to track over time for significant changes in volume and velocity.
Arm taking a greater market share of global computing wont happen overnight. However, we can already see threat actors taking an interest in exploits, and the volume will likely increase as Arm chips proliferate in mainstream computing platforms. The gradual shift could create security implications that organizations want to proactively address, starting with endpoint defense and a review of commercial solutions.
Network Exploit Velocity
Quantifying velocity is as much about pattern recognition as the time change state between data points. As previously mentioned, China is actively exploiting network appliances for multiple reasons, and more defender effort is required as traditional host-based security solutions (i.e., AV/EDR/XDR) are rendered impotent.
The velocity component is relevant to address as it drives the movement level in attack proximity for any of the five risk impacts. A more significant east/west move in the proximity & resilience graph may drive more operational urgency, depending on the corresponding level of resilience.
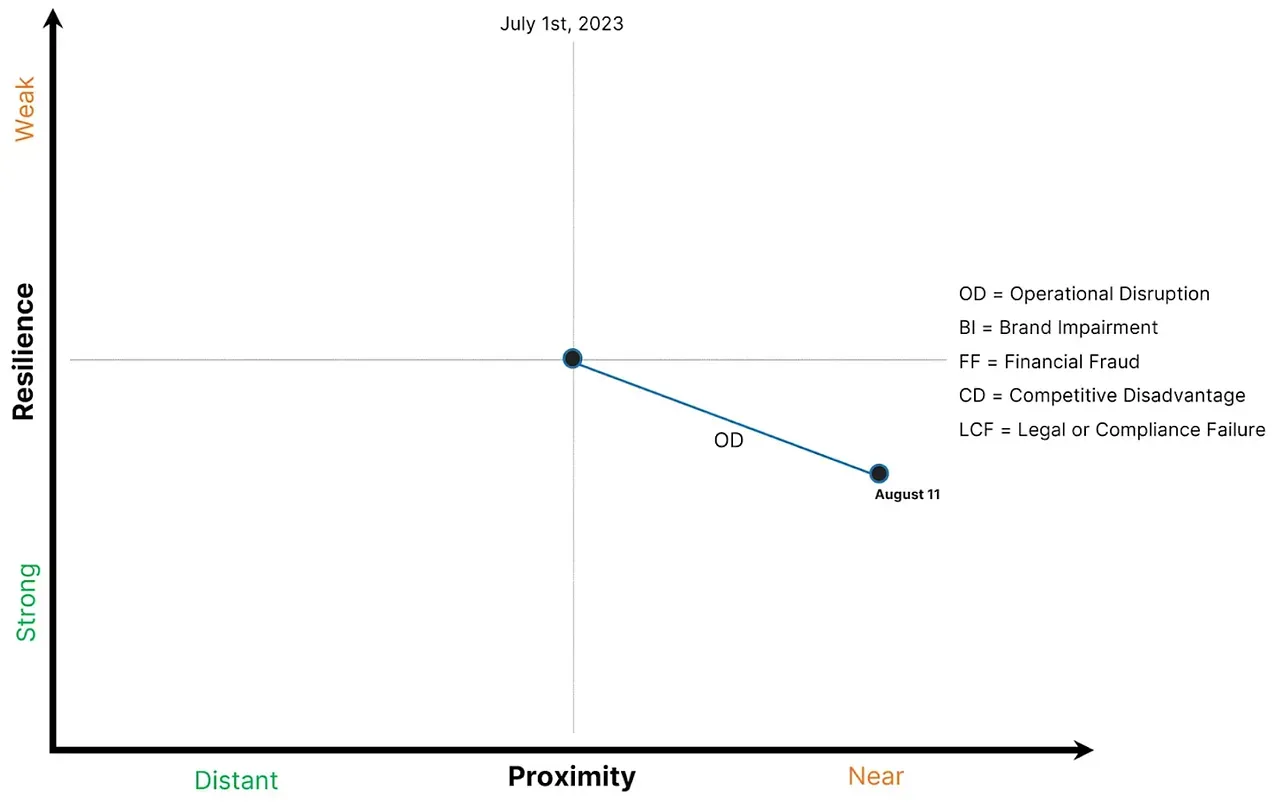
Image: An example of a Proximity & Resilience Graph
Cisco network appliances are a recent example of Chinas zero-day exploit targeting. The velocity of these exploits is challenging to determine (until its too late) without telemetry that extends beyond OSINT.
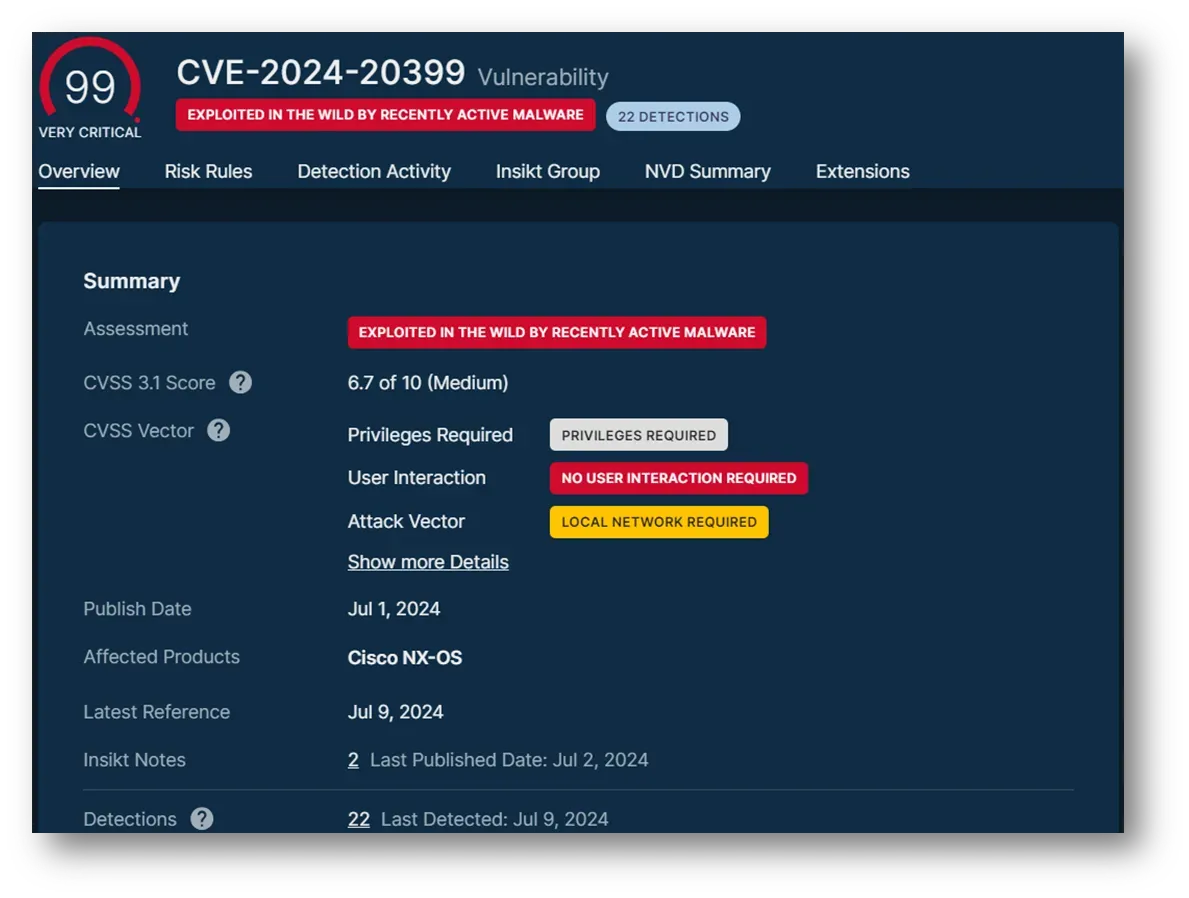
Image: A vulnerability intelligence summary courtesy of Recorded Future.
In the timeline below, the distance between data points roughly represents velocity. In the subsequent graph, a volume change is represented across two different categories of vulnerabilities. A comprehensive search and verified results for applicable vulnerabilities with associated exploitation are a starting point, and ongoing signals from telemetry like darknets/honeypots can also provide more current and timely data toward an accurate velocity representation. Audiences should quickly identify the potential urgency attached to the threat, which dictates the speed of I2R pyramid traversal to ultimately implement recommendations.
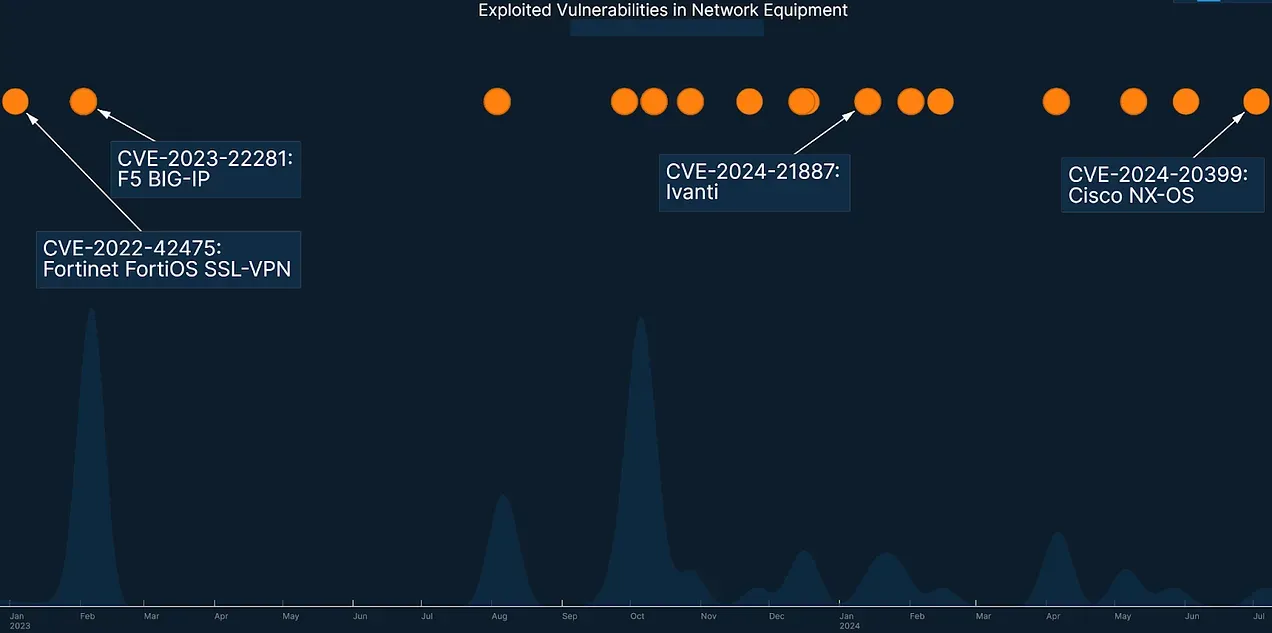
Image: A 2023 – 2024 timeline containing samples of network equipment exploitation courtesy of Recorded Future.
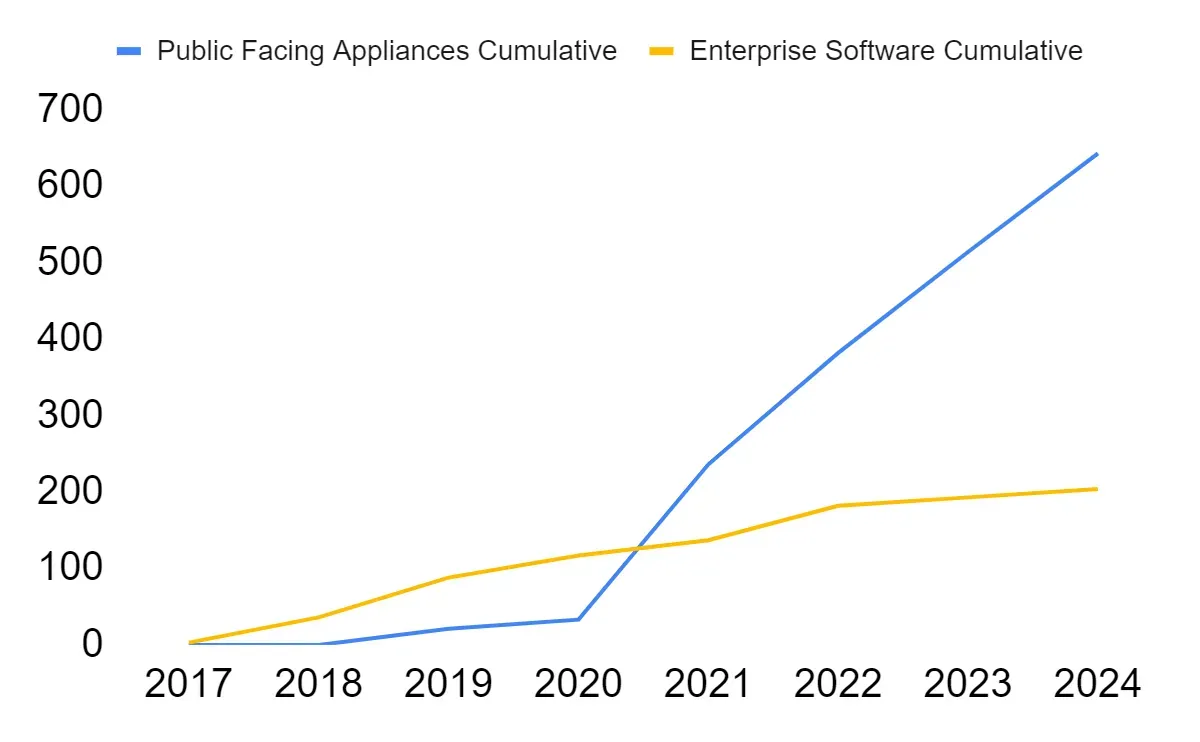
Image: Cumulative cyber attack and exploit references to vulnerabilities divided between network appliances and enterprise software, courtesy of Dylan Davis and Recorded Future.
Similarly, Recorded Futures Insikt Group recently released a report on Threat Actor Group 100 (TAG-100, which is likely a state-sponsored group from a country that begins with and ends with ), which has compromised organizations in over ten countries. The image below helps illustrate attack volume and TTP velocity, specifically with the continuous use of open-source tools like Pantegana.
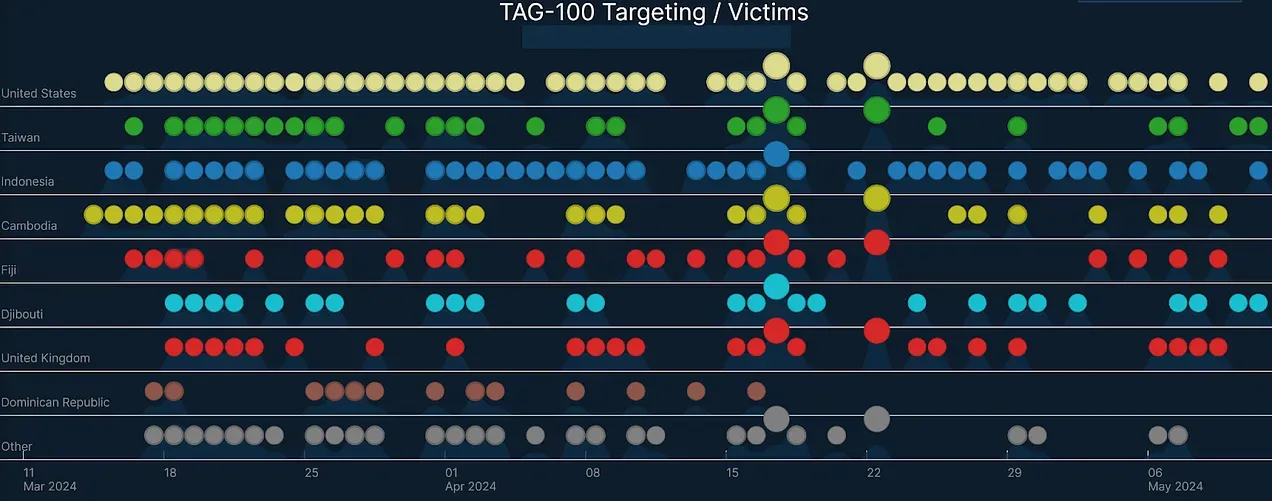
Image: A timeline of spring 2024 TAG-100 targeting courtesy of Recorded Future.
When open-source attack tools increase in observed velocity, the operational urgency around existing control validation is apparent (even without a full I2R Pyramid assessment). Based on anecdotal feedback, EDR/XDR software sometimes lacks robust detections for offensive open-source resources.
Conclusion
As a security professional, how can you persuade executives to smartly invest? Your role is crucial in this process. Envision a typical enterprise environment: the breaches making the latest rounds of headlines are in different industries. Wheres the fire? The metaphorical moat seems to be holding. Audits passed. The GRC/ERM organization is documenting the risks. The organization has previously invested in substantial security controls. Your insights can help shape the narrative and drive action where needed the most (and sometimes, inaction is an equally valid risk management decision).
Intelligence should be sourced from data that creates proactive opportunities to evaluate and communicate threat volume and velocity. These two factors move emerging threats from theoretical to practicalwhat separates a $1M story from just another presentation slide. As an industry, we need more $1M stories to help build confidence in aligning cyber risk management strategies with business needs and objectives.


Leave a Reply